Query Editor
Sometimes you have a quick question of your data that doesn't really warrant
opening up
Excel or your favourite reporting tool. This is where our Query Editor comes in!
> Got a little more time? We have a [detailed blog post here](https://blog.synchub.io/articles/queryeditor)
### How it works
It's pretty simple really - our Query Editor uses the _read-only_ credentials provided
by SyncHub to execute your SQL directly against your data warehouse. Afterwards, you can **save and share** the result with other collaborators in your
organisation.
You can do some pretty awesome and powerful things with your Query Editor. Here are some of the features and tools to help you become a master.
### Data model
To aid you with constructing your queries in the query editor, we provide a view of the data model for each of your connections so that you
may see what tables and columns are available for each of the connectors.
From the tools menu in the top right of the query editor, click **show endpoints**. You will then get the following expandable view
listing each connector with its available tables and columns. You can click
on the blue arrows to automatically insert the column or table name into your query
at the location of the cursor.
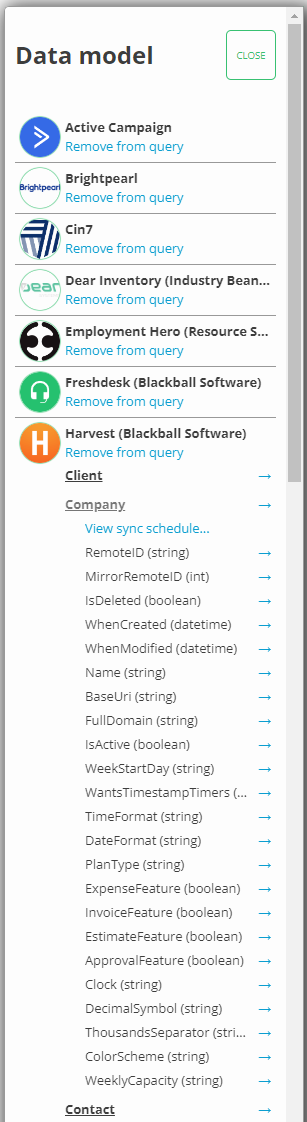
From the data model popup, you can also open the sync window for each of the endpoints,
allowing you to manually re-sync data for specific end points without needing to leave
the query editor.
### Handling multiple connections to the same cloud platform
To make your queries easier to read, you can use the **CONNECTIONS**
placeholder in place of the actual database name -for example, _[CONNECTIONS.xero]_ would
connect to your Xero schema.
If, however, you have two or more of the
same type of connector, using this ambiguous term will cause an error.
There are two ways to report across multiple connections of the same type:
#### Solution 1/2 - You only need to reference one of the duplicate connections
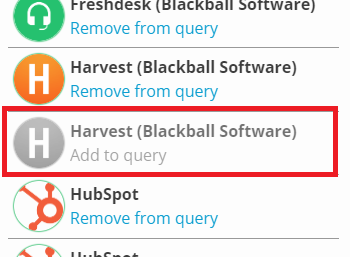
In this case, you can simply use the data model to **remove from query** the connections that you don't want to use. You will see it becomes greyed out, and now using **CONNECTIONS.harvest** will only reference the connection that is still active for this query.
#### Solution 2/2 - You need to be able to reference more than connection to the same cloud platform in the same query
To support this, you can click on the blue arrow next to a table name to insert
that table _with its specific schema_, as shown below. This allows you to,
for example, gather all of you invoices from two different Harvest accounts and view
them in a single query.
### Show calculated SQL
Another option from the tools menu is **show calculated SQL**. Clicking this will
open a window showing the exact SQL that you query will be executed as.
This is particularly useful to be able to see how your parameters and **embedded queries**
are actually being run in the context of the query you are currently editing. A button
to view the calculated SQL will also appear when a query encounters an error when run.
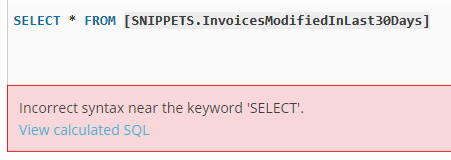
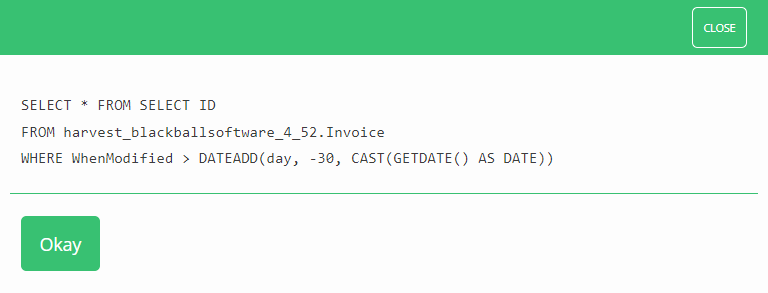
For example, executing the following query gives an error, and when viewing the calculated
SQL, it becomes clear that this is a malformed SQL query.
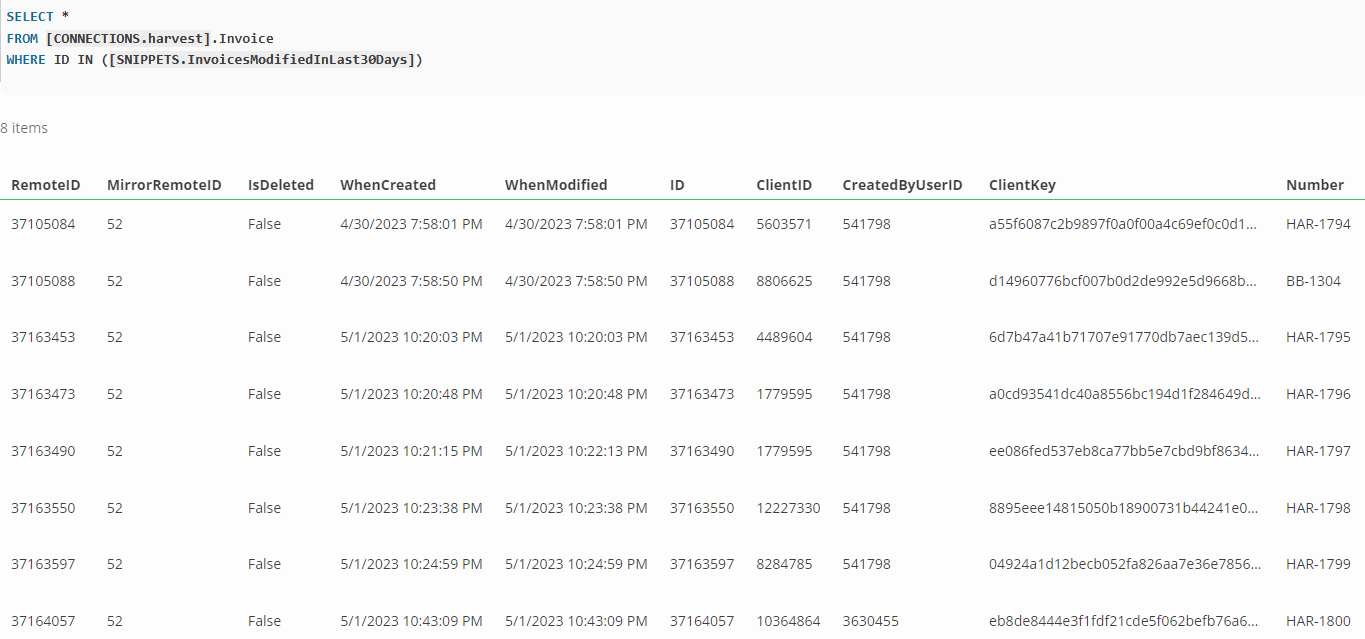
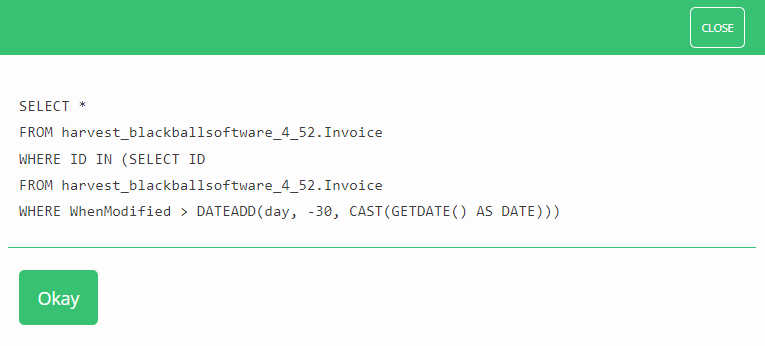
You would then see that the correct way to form this query utilising your embedded query
would be as so:
### Parameters
For advanced filtering and caching make sure you read up on our [Insight Parameters](/kb/insightparameters?api=vend).